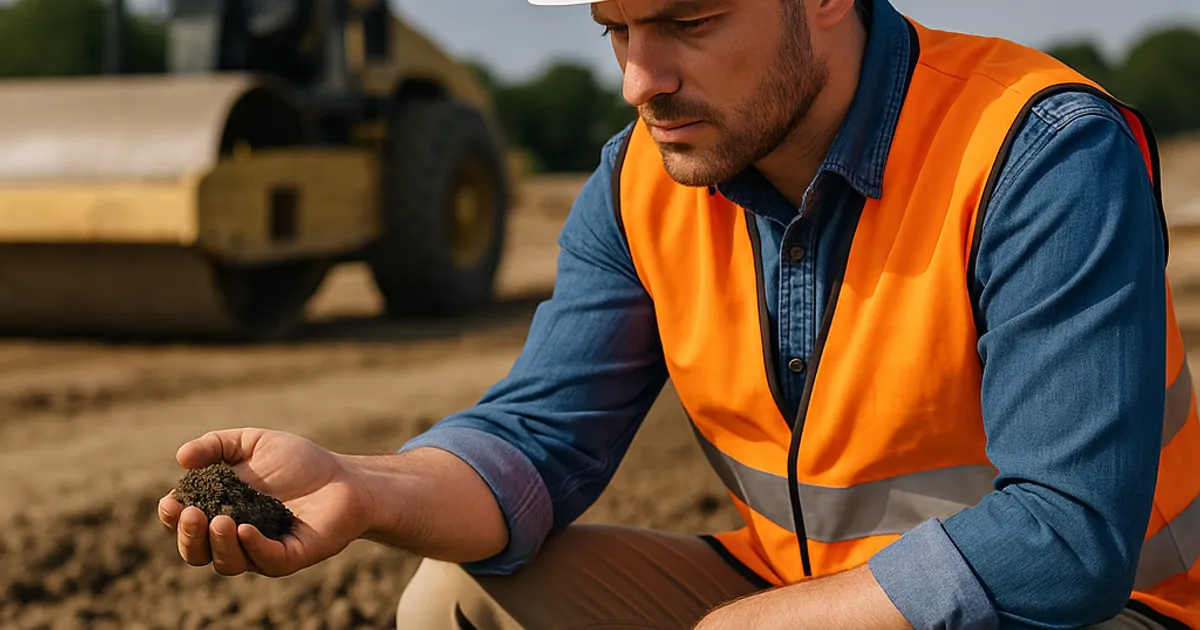
When a skyscraper rises from the ground or a highway stretches across a mountainous landscape, the invisible foundation beneath it all is doing the most critical work. The soil—its composition, behavior under stress, and response to moisture—determines whether that structure thrives for a century or fails within a decade. At the heart of understanding soil behavior lie two foundational geotechnical properties: soil plasticity and the liquid limit. Together with the plastic limit, they form the Atterberg limits, a classification system that has guided civil engineering decisions since Swedish soil scientist Albert Atterberg first described them in 1911.
For earthwork contractors, geotechnical engineers, and construction project managers, these properties are not abstract scientific concepts—they are daily decision-making tools. They determine which soils can be compacted for embankments, which require stabilization before use, which are unsuitable as fill, and which could spell disaster if used beneath a road, retaining wall, or building foundation. Understanding them deeply can mean the difference between a project delivered on time and on budget versus one riddled with costly failures, litigation, and delays.
This guide dives deep into soil plasticity and liquid limit: what they are, how they are tested, what the numbers mean, and how they translate into real-world construction outcomes across the United States and beyond.
What Is Soil Plasticity? The Fundamentals Every Contractor Must Know
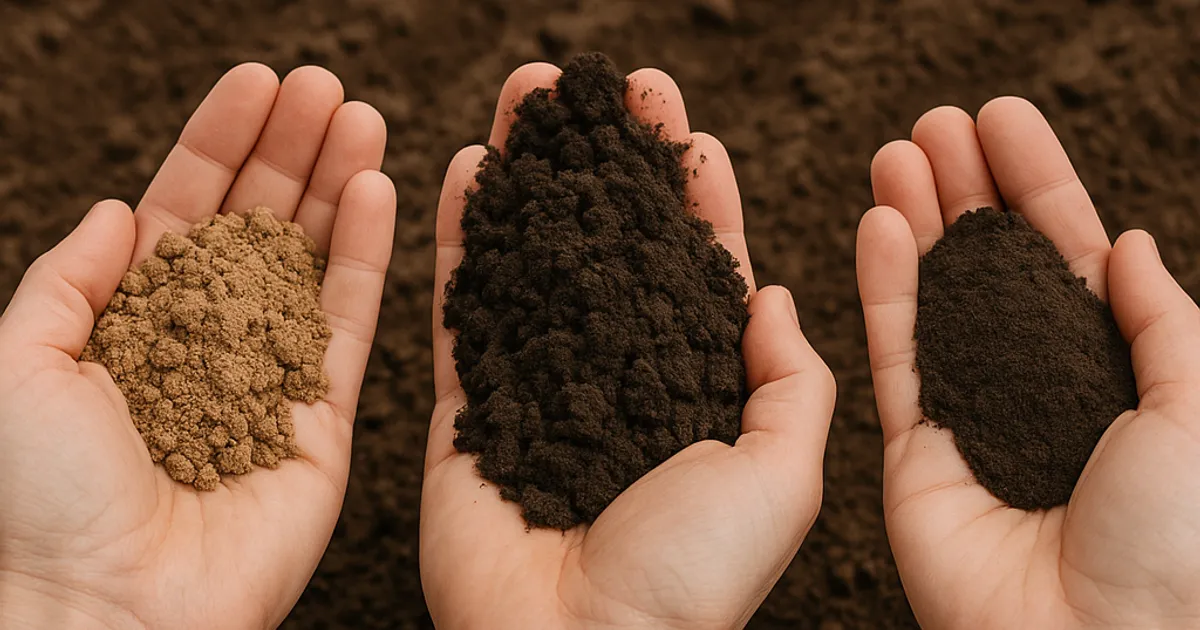
Soil plasticity refers to a soil's ability to be deformed without cracking or crumbling—essentially, its capacity to change shape while retaining cohesion. Think of it like the difference between modeling clay (highly plastic) and dry sand (non-plastic). The property is a direct function of the type and quantity of clay minerals present in the soil, as well as the nature of the water interacting with those minerals.
Clays are inherently plastic because of their platy, sheet-like mineral structures. Common clay minerals—kaolinite, illite, smectite (montmorillonite), and chlorite—differ enormously in their plasticity. Montmorillonite, found in expansive soils common across the American Southwest, Gulf Coast, and parts of the Great Plains, is extraordinarily plastic and can swell up to 15 times its dry volume when exposed to water. Kaolinite, by contrast, is far less reactive, making soils dominated by it more stable and predictable for construction purposes.
The plasticity of a soil is quantified using the Plasticity Index (PI), which is calculated as:
PI = Liquid Limit (LL) – Plastic Limit (PL)
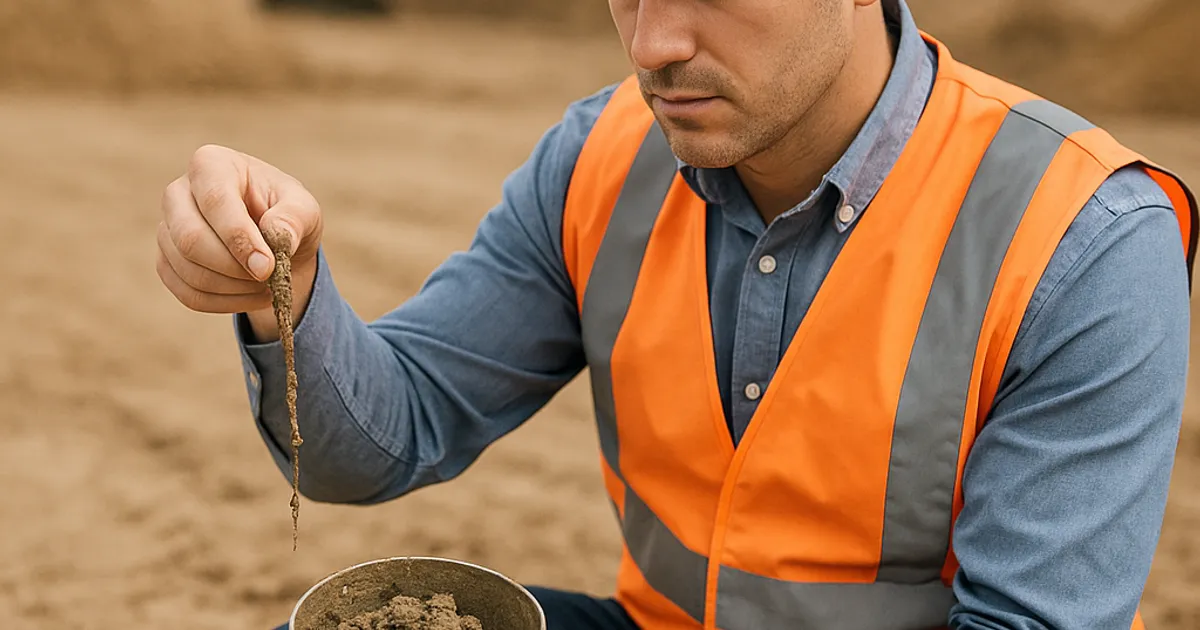
The plastic limit represents the water content at which the soil transitions from a semi-solid to a plastic state—it's the point where the soil begins to crumble when rolled into a 3mm thread. The liquid limit (detailed extensively in the next section) is the water content at which the soil transitions from a plastic to a liquid state. The range between these two limits—the PI—tells engineers how wide the "workable window" of the soil actually is.
A PI of 0 indicates a non-plastic soil like clean sand or gravel. A PI between 1 and 7 is considered low plasticity, 7–17 is medium plasticity, and anything above 17 is considered high plasticity. Soils with a PI exceeding 50 are sometimes called "fat clays" and represent some of the most challenging materials in construction.
Why Plasticity Matters on the Job Site
From a practical standpoint, plasticity governs compaction behavior, load-bearing capacity, shrink-swell potential, and susceptibility to frost heave. A highly plastic clay compacted at the wrong moisture content can develop significant differential settlements over time, cracking pavements, tilting foundations, and rupturing buried utilities. In contrast, a properly characterized low-plasticity soil can be an ideal fill material.
For projects involving large volumes of fill dirt—such as land grading, embankment construction, or site development—knowing the plasticity of the available material is essential. Platforms like DirtMatch help earthwork contractors connect with nearby sources of fill dirt, enabling them to evaluate material suitability before committing to hauling costs that can range from $8 to $25 per cubic yard depending on distance and material type.
Understanding the Liquid Limit: Definition, Science, and Significance
The liquid limit (LL) is defined as the water content, expressed as a percentage of dry soil weight, at which the soil transitions from a plastic solid to a viscous liquid. At the liquid limit, the soil has just enough shear strength to barely hold together. In engineering terms, the liquid limit corresponds to a shear strength of approximately 1.7 kPa (about 0.25 psi)—an extremely low value that illustrates how vulnerable highly plastic soils are when saturated.
The liquid limit was originally determined using the Casagrande cup method, standardized under ASTM D4318, which remains the most widely referenced test method in the United States today. In this test, a soil paste is placed in a brass cup, a groove is cut through it with a standardized tool, and the cup is dropped from a height of 10mm using a mechanical or hand-operated device. The water content at which 25 blows close the groove by 13mm is defined as the liquid limit.
A more modern alternative, increasingly adopted internationally, is the fall cone test (ASTM D4318-17 Annex; BS 1377 in the UK), which some researchers argue provides more repeatable and operator-independent results. Studies from institutions like the Transportation Research Board have shown that the fall cone method can reduce variability in LL determination by up to 30% compared to the Casagrande cup under inconsistent lab conditions.
Liquid Limit Values and What They Tell You
Liquid limit values vary enormously across soil types:
| Soil Type | Typical Liquid Limit (%) | Typical PI | Classification (USCS) |
|---|---|---|---|
| Gravel / Clean Sand | Non-plastic | 0 | GW, GP, SW, SP |
| Silty Sand | 0–20 | 0–5 | SM |
| Low-plasticity Clay (CL) | 20–35 | 7–17 | CL |
| High-plasticity Clay (CH) | >50 | >17 | CH |
| Organic Clay | 40–120+ | Variable | OH, OL |
| Montmorillonite Clay | 100–600+ | 50–500+ | CH/MH |
| Kaolinite Clay | 38–75 | 15–40 | CL/CH |
The liquid limit is a foundational input for the Unified Soil Classification System (USCS), codified in ASTM D2487, and the AASHTO Soil Classification System (M 145), both of which are used in virtually every state DOT specification in the country. For example, the California Department of Transportation (Caltrans) uses LL and PI thresholds to define acceptable embankment fill, while the Texas Department of Transportation (TxDOT) specifies maximum PI values for subgrade materials in pavement design.
ASTM Standards and Testing Procedures: The Technical Framework
Accurate determination of liquid limit and plasticity index requires strict adherence to standardized test procedures. The key standards governing Atterberg limit testing in the United States include:
- ASTM D4318 – Standard Test Methods for Liquid Limit, Plastic Limit, and Plasticity Index of Soils
- ASTM D2487 – Practice for Classification of Soils for Engineering Purposes (USCS)
- ASTM D3282 – Practice for Classification of Soils and Soil-Aggregate Mixtures for Highway Construction Purposes (AASHTO)
- AASHTO T 89 / T 90 – Determining the Liquid Limit / Plastic Limit and Plasticity Index of Soils
Step-by-Step: Performing the Liquid Limit Test (ASTM D4318)
Step 1: Sample Preparation Obtain approximately 500 grams of soil passing the No. 40 sieve (0.425mm). Mix thoroughly with distilled water to form a uniform paste.
Step 2: Casagrande Cup Setup Calibrate the cup to drop exactly 10mm. Place soil in the cup to a depth of about 10mm at the deepest point.
Step 3: Groove Creation Draw the grooving tool through the center of the soil pat to create a clean groove separating the soil into two halves.
Step 4: Drop Counting Crank the device at a rate of approximately 2 drops per second, counting until the groove closes over a 13mm length. Record the blow count and immediately collect a moisture sample.
Step 5: Repeat Conduct at least 3–4 trials at different water contents, targeting blow counts between 10 and 40 blows. Plot water content vs. log(blow count) on a flow curve.
Step 6: Interpolation The water content corresponding to 25 blows on the flow curve is the liquid limit.
Testing Costs and Turnaround Times
Laboratory testing for Atterberg limits typically costs between $75 and $200 per sample at commercial geotechnical laboratories, with turnaround times ranging from 1 to 5 business days. For larger projects requiring dozens of samples—say, a 50-acre residential subdivision—total testing costs can easily reach $5,000–$15,000. Proper budgeting for geotechnical investigation, including LL and PI testing, typically runs 0.5%–2% of total project construction costs, according to data published by the Geo-Institute of ASCE.
The Plasticity Chart: Reading the USCS Classification System
One of the most powerful tools in geotechnical engineering is the Casagrande Plasticity Chart, which plots Plasticity Index (y-axis) against Liquid Limit (x-axis) and divides the space into classification zones. The A-line on this chart, defined by the equation PI = 0.73(LL – 20), separates clays (above the A-line) from silts (below the A-line).
Soils that fall above the A-line and have LL > 50 are classified as CH (fat clays)—notoriously difficult to work with in construction. Those below the A-line with LL > 50 are classified as MH (elastic silts), which can be even more problematic due to their unpredictable compaction behavior.
The U-Line Boundary
The U-line, defined by PI = 0.9(LL – 8), represents the upper boundary of naturally occurring soils on the plasticity chart. Any soil plotting above the U-line is suspect and warrants further investigation, as it may indicate laboratory error or an unusual material composition such as highly organic content or volcanic ash.
Practical Implications of Classification
For earthwork contractors selecting fill material, the USCS classification directly translates into field performance. A GW (well-graded gravel) or SW (well-graded sand) is ideal for most fill applications. A CL (lean clay) may be acceptable for embankment cores with proper compaction control. A CH (fat clay) or MH (elastic silt) should generally be excluded from structural fill applications without extensive treatment.
Understanding these classifications is particularly valuable in high-demand urban construction markets. For instance, projects in the Pacific Northwest—particularly the dirt exchange in Seattle market—frequently encounter glacially deposited silty and clayey soils that require careful plasticity characterization before reuse on other sites.
How Liquid Limit and Plasticity Influence Foundation Design
Foundation engineering is perhaps where soil plasticity has its most dramatic and costly impact. The consequences of building on poorly characterized plastic soils are well-documented and financially devastating. According to the Federal Highway Administration (FHWA), expansive soils—most of which are highly plastic clays—cause an estimated $15 billion in damage annually to foundations, roads, and utilities in the United States alone, more than the combined annual damage from earthquakes, floods, hurricanes, and tornadoes.
Expansive Soils and Liquid Limit Thresholds
The relationship between liquid limit and swell potential has been extensively studied. Chen (1988) proposed one of the most widely cited correlations:
| Liquid Limit (%) | Swell Potential |
|---|---|
| < 30 | Low |
| 30–40 | Medium |
| 40–60 | High |
| > 60 | Very High |
Building codes in states like Colorado, Texas, and California now require expansive soil identification and mitigation in residential construction. The International Residential Code (IRC) Section R403.1.8 mandates specific footing designs for expansive soils. Denver, Colorado—a city with significant expansive soil challenges—has seen foundation repair costs average $10,000–$40,000 per home when expansive soils are not properly addressed. Contractors working in the dirt exchange in Denver market must be acutely aware of local expansive soil conditions before accepting or placing fill materials.
Bearing Capacity Reduction with Increasing Water Content
As soil water content approaches the liquid limit, its undrained shear strength (Cu) drops precipitously. The relationship between water content and shear strength for fine-grained soils follows a logarithmic decay. A soil with an unconfined compressive strength of 200 kPa at optimum moisture content may have a strength of less than 25 kPa when its water content approaches the liquid limit. This is why construction during rainy seasons can suddenly render previously stable excavations and fill areas unsafe and unsuitable.
Soil Stabilization: Engineering Solutions for High-Plasticity Soils
When the soil at a project site has an unacceptably high liquid limit or plasticity index, contractors have several stabilization options available. These techniques chemically or mechanically alter the soil's mineralogy to reduce its plasticity and improve its engineering properties.
Lime Stabilization
Lime stabilization is one of the oldest and most cost-effective methods for treating high-plasticity clays. When quicklime (CaO) or hydrated lime (Ca(OH)₂) is mixed into a plastic clay soil, it triggers a pozzolanic reaction in which calcium ions exchange with the clay mineral surface, reducing the plasticity index dramatically. Research from the University of Texas at Austin has demonstrated PI reductions of 20–40 points within 24 hours of lime treatment.
Typical lime application rates range from 3% to 8% by dry weight of soil. The cost of lime stabilization in the field typically runs $4 to $10 per square yard (for a 6-inch treatment depth), making it one of the most economical ground improvement options available.
Portland Cement Stabilization
Cement stabilization works through hydration reactions that bind soil particles together, reducing plasticity and dramatically increasing unconfined compressive strength. The Texas DOT, for example, specifies cement-treated subgrade (CST) extensively in its pavement design standard, Item 275, requiring minimum compressive strengths of 150–300 psi after 7 days of curing.
Fly Ash and Pozzolan Treatment
Class C fly ash—a byproduct of coal combustion—contains sufficient free lime to trigger self-cementing reactions in clay soils. Class F fly ash requires the addition of lime activators. Both are growing in use due to their lower cost (often $20–$50 per ton compared to $80–$150 per ton for lime) and environmental benefits of recycling industrial byproducts.
Geosynthetic Reinforcement and Replacement
In some cases where stabilization costs exceed the value gained, complete removal and replacement with engineered fill may be the most practical solution. This is where efficient material sourcing becomes critical. DirtMatch Pro connects earthwork contractors with verified sources of engineered fill, aggregate, and structural backfill materials, streamlining the material procurement process and helping projects avoid the delays and cost overruns that come with last-minute material sourcing.
Pavement Engineering: How Liquid Limit Governs Subgrade Performance
In pavement engineering, the subgrade soil's Atterberg limits are among the most influential inputs in both flexible (asphalt) and rigid (concrete) pavement design. The AASHTO Pavement Design Guide and its successor, the Mechanistic-Empirical Pavement Design Guide (MEPDG), both incorporate soil classification—fundamentally tied to liquid limit and PI—into their structural design procedures.
The Subgrade Reaction Modulus and Plasticity
The California Bearing Ratio (CBR) and the resilient modulus (Mr) of subgrade soils are inverse functions of their plasticity. A subgrade with PI = 5 might have a CBR of 20–30%, while one with PI = 30 might test at CBR 2–5%. Since pavement thickness is designed around subgrade CBR or Mr values, highly plastic subgrades require substantially thicker pavement sections—a cost multiplier that can add hundreds of thousands of dollars to a road construction project.
For a typical two-lane rural highway, increasing the CBR from 3% to 15% (achievable through lime stabilization of a plastic clay subgrade) can reduce required base course thickness from 24 inches to 12 inches, representing material cost savings of $50,000–$150,000 per mile depending on material costs.
State DOT Specifications for Subgrade Plasticity
Virtually every state DOT has specific plasticity requirements for subgrade and fill materials. A sampling of representative limits includes:
| State DOT | Maximum PI for Embankment Fill | Maximum LL for Subgrade |
|---|---|---|
| California (Caltrans) | 12 | 35 |
| Texas (TxDOT) | 20 (untreated) | 45 |
| Florida DOT | 10 | 35 |
| Colorado DOT | 15 | 40 |
| Washington DOT | 6 | 25 |
| New York DOT | 10 | 30 |
These specifications directly determine which materials can be legally placed on public transportation infrastructure projects, making pre-qualification testing essential.
Find or Post Dirt, Rock & Aggregate
Join thousands of contractors using DirtMatch to buy, sell, and exchange earthwork materials.
Try DirtMatch FreeRegional Soil Challenges: High-Plasticity Soils Across the U.S.
Soil conditions vary dramatically across the United States, and regional geology creates predictable zones of high-plasticity soil challenges that contractors and engineers must anticipate.
The Gulf Coast and Texas Blackland Prairie
The Blackland Prairie of central Texas is underlain by the Taylor and Austin Chalk formations, which weather into some of the most expansive montmorillonite clays in North America. Liquid limits routinely exceed 70–90%, with PI values of 40–60 being common. The shrink-swell cycles in this region cause an estimated $1.2 billion in annual infrastructure damage in Texas alone.
The Denver Metro Area
Denver sits atop the Denver Formation and Pierre Shale, both of which produce highly expansive bentonitic clays. PI values of 30–60 are routine in eastern Denver suburbs. The local building industry has developed specialized foundation systems—including drilled piers extending 25–40 feet to stable bedrock—specifically in response to these conditions.
The Pacific Coast
From San Francisco to Los Angeles, California's coastal soils present complex challenges. Bay Mud in the San Francisco Bay Area is a highly plastic, organic-rich marine clay with liquid limits frequently exceeding 80–120%. Major infrastructure projects like the Bay Bridge approach fills required extensive ground improvement including stone columns, wick drains, and surcharge preloading to manage settlement in these materials. In Southern California, the presence of expansive adobe soils in the inland valleys creates similar challenges for residential and commercial developers.
The Northeast and New England
Boston's famous "Boston Blue Clay," a glaciomarine deposit, has liquid limits of 40–70% and has been the bane of underground construction in the city for over a century. The infamous "Big Dig" project had to contend extensively with this material. Similarly, the dirt exchange in Boston market sees constant demand for clean, low-plasticity fill to replace or cap these problematic native soils in redevelopment projects.
Environmental and Regulatory Considerations
Beyond the geotechnical implications, the liquid limit and plasticity of soil have important environmental and regulatory dimensions that contractors cannot afford to overlook.
Landfill Liner Requirements
The U.S. Environmental Protection Agency (EPA) regulations under RCRA (Resource Conservation and Recovery Act) specify that clay liner materials for municipal solid waste landfills must have a liquid limit ≥ 30% and a PI ≥ 15%. This requirement exists precisely because higher plasticity correlates with lower hydraulic conductivity—highly plastic clays are more effective at preventing leachate migration. Contractors sourcing clay liner materials must provide Atterberg limit test data as part of their material certification documentation.
Contaminated Soil Assessment
Soil plasticity also affects the behavior and fate of contaminants in the subsurface. The large surface area of clay minerals in high-plasticity soils tends to adsorb heavy metals and organic contaminants more effectively than low-plasticity soils, making plasticity data relevant to environmental site assessments conducted under EPA Superfund guidelines and state environmental programs.
Stormwater and Erosion Control
High-plasticity soils, when properly compacted, form effective barriers to water infiltration and are often used in earthen dam construction and stormwater retention features. However, these same soils are highly susceptible to erosion in their disturbed state—a critical consideration for NPDES (National Pollutant Discharge Elimination System) stormwater permit compliance during active construction. OSHA and state environmental agencies require contractors to implement erosion controls that account for the erodibility of exposed soils, which is directly influenced by their plasticity characteristics.
Compaction Optimization: Plasticity's Role in Proctor Testing
The relationship between soil plasticity and compaction behavior is fundamental to earthwork quality control. The Standard Proctor Test (ASTM D698) and Modified Proctor Test (ASTM D1557) determine the optimum moisture content (OMC) and maximum dry density (MDD) for a given soil—values that directly govern field compaction specifications.
How Plasticity Shifts the Compaction Curve
High-plasticity soils exhibit several characteristic compaction behaviors:
- Lower maximum dry density – Fat clays typically achieve MDD values of 90–105 pcf compared to 120–135 pcf for granular materials
- Higher optimum moisture content – High-PI soils require more water at OMC (often 20–30%) versus sands (8–12%)
- Flatter compaction curves – High-plasticity soils are less sensitive to moisture variation, providing slightly more compaction tolerance
- Greater sensitivity to overcompaction on the dry side – Clays compacted dry of optimum can be brittle and prone to cracking
Field Compaction Control
Field density testing for plastic clay fills is typically conducted using the nuclear density gauge (ASTM D6938) or the newer light weight deflectometer (LWD) method. Most highway and building specifications require compaction to 90–95% of Modified Proctor MDD for structural fill. For highly plastic clays, some specifications require compaction at 1–3% wet of optimum moisture content specifically to minimize shrinkage cracking potential.
Contractors working with mixed soil types across a large site—common in cut-and-fill operations—need efficient systems to track material characteristics across different source areas. Streamlining material matching between surplus and deficit locations is exactly the kind of workflow where understanding how DirtMatch works can save contractors significant time and expense, particularly when managing multiple soil types with different compaction specifications.
Cost Implications: Soil Plasticity's Impact on Project Economics
Soil plasticity is not merely a technical concern—it has profound and quantifiable economic impacts on construction projects at every scale. Understanding these cost implications allows project owners and contractors to make informed decisions about site investigation, material selection, and ground improvement investments.
Geotechnical Investigation Investment
The cost of an inadequate geotechnical investigation is almost always far higher than the investigation itself. Industry data suggests that for every dollar spent on geotechnical investigation, $10–$100 in construction cost surprises are avoided. Atterberg limit testing, at $75–$200 per sample, represents one of the highest-value data points a project team can obtain.
Material Selection and Hauling Costs
Choosing the wrong fill material due to inadequate plasticity characterization can lead to:
- Subgrade failure and pavement reconstruction: $200,000–$1,000,000+ per mile
- Foundation differential settlement: $25,000–$250,000 per structure
- Embankment slope instability: $500,000–$5,000,000+ depending on scale
- Regulatory non-compliance fines: $5,000–$50,000+ under state DOT or EPA programs
Conversely, properly matching low-plasticity fill materials with projects that need them—and directing high-plasticity materials to appropriate uses like clay liners—creates genuine economic value. This is the core concept behind dirt exchange platforms. By connecting contractors who have surplus excavated material with those who need fill, waste is minimized and material costs are reduced significantly. For contractors navigating these decisions in active markets like dirt exchange in San Diego or dirt exchange in Boulder, having access to material characterization data alongside efficient matching tools can transform project economics.
Stabilization Cost-Benefit Analysis
When a site has unavoidably high-plasticity soils, the decision to stabilize versus remove and replace should be based on a rigorous cost-benefit analysis:
| Factor | Lime Stabilization | Remove & Replace |
|---|---|---|
| Typical Cost (6" depth) | $4–$10/sq yd | $12–$30/sq yd |
| Speed | 1–3 days cure | Immediate |
| Environmental Impact | Moderate | Higher (hauling) |
| Long-term Performance | Excellent if done correctly | Depends on fill quality |
| Risk of Failure | Low (well-documented) | Low (with good fill) |
Quality Assurance and Quality Control Protocols
Robust QA/QC protocols for soil plasticity testing are essential for compliance with project specifications and protection against liability. Best practices include:
Laboratory Accreditation
Always use AASHTO-accredited or CCRL (Cement and Concrete Reference Laboratory) accredited laboratories for Atterberg limit testing. Accreditation ensures the laboratory participates in proficiency testing programs and demonstrates measurement accuracy within defined tolerances.
Frequency of Testing
For large fill projects, ASTM and state DOT guidance typically recommends Atterberg limit testing at the following minimum frequencies:
- Borrow area characterization: 1 test per 1,000–5,000 cubic yards or whenever visual soil type changes
- Embankment construction QC: 1 test per lift per 500 linear feet of embankment
- Subgrade preparation: 1 test per 500–1,000 square yards or as directed by the engineer
Documentation and Traceability
Maintain complete chain-of-custody documentation for all samples, including sample location coordinates, depth, collection date, and the technician's name. This documentation is essential for resolving disputes and demonstrates due diligence in the event of a claim.
Emerging Technologies: The Future of Plasticity Characterization
The geotechnical industry is not standing still, and several emerging technologies promise to transform how soil plasticity is measured and interpreted in construction contexts.
Portable X-Ray Fluorescence (pXRF)
pXRF devices can rapidly identify clay mineral types in the field based on elemental composition, providing a preliminary indication of plasticity potential within minutes. While not a replacement for ASTM D4318 testing, pXRF can help geotechnical engineers prioritize laboratory testing and make real-time decisions during earthwork operations.
Machine Learning and Predictive Modeling
Research published in the Journal of Geotechnical and Geoenvironmental Engineering has demonstrated that machine learning algorithms—trained on large geotechnical databases—can predict Atterberg limits from grain size distribution data with R² values exceeding 0.85. This capability could significantly reduce testing costs and turnaround times for large-scale projects.
NIR Spectroscopy for Moisture and Plasticity Estimation
Near-infrared (NIR) spectroscopy systems can estimate soil water content and clay mineral content in real time, enabling continuous monitoring of fill material plasticity during placement. Several state DOTs are piloting these systems for intelligent compaction monitoring.
Digital Twins and BIM Integration
Building Information Modeling (BIM) platforms are increasingly incorporating subsurface geotechnical data, including Atterberg limit profiles, into 4D construction models. This integration allows project teams to visualize spatially varying soil plasticity across a site and optimize earthwork cut-and-fill operations accordingly.
Practical Checklist: Soil Plasticity and Liquid Limit for Your Next Project
To synthesize everything covered in this guide, here is a practical pre-construction checklist for addressing soil plasticity and liquid limit on earthwork projects:
During Site Investigation:
- Collect representative soil samples from all major soil units identified in borings and test pits
- Submit samples for ASTM D4318 Atterberg limit testing at an accredited laboratory
- Plot results on the Casagrande plasticity chart and classify soils per ASTM D2487
- Identify any soils with LL > 50 or PI > 20 for special attention
- Conduct swell testing (ASTM D4546) on any soils with LL > 40
During Design:
- Verify fill material specifications comply with applicable DOT or project specifications
- Design soil stabilization program for any on-site soils that exceed PI or LL limits
- Determine whether import fill is needed and begin early sourcing
- Incorporate plasticity-based compaction specifications into project contract documents
During Construction:
- Implement laboratory and field testing QA/QC program
- Monitor weather forecasts and suspend fill placement during rain events if PI > 15
- Maintain moisture conditioning of fill within ±2% of optimum prior to compaction
- Document all test results and maintain chain-of-custody records
For Material Sourcing:
- Obtain material certification data (including Atterberg limits) from all borrow sources
- Use digital platforms to efficiently connect surplus excavation material with nearby projects needing fill
- Evaluate cost-effectiveness of stabilization versus removal for high-plasticity soils
For earthwork contractors looking to simplify material sourcing and ensure they're working with properly characterized fill materials, get started with DirtMatch to access a network of verified material sources and connect with contractors in your region.
Conclusion
Soil plasticity and the liquid limit are not esoteric laboratory curiosities—they are foundational engineering properties with direct, measurable impacts on construction safety, cost, and performance. From the expansive black clays of the Texas Blackland Prairie to the marine deposits beneath Boston's historic downtown, high-plasticity soils represent one of the construction industry's most persistent and costly challenges. But with proper site investigation, standardized ASTM testing protocols, appropriate material selection, and proven stabilization techniques, these challenges are entirely manageable.
For earthwork contractors, the message is clear: invest in understanding your soil before you move it, place it, or compact it. The $150 spent on an Atterberg limit test today can prevent a $150,000 foundation failure tomorrow. And when you need to source low-plasticity fill, dispose of surplus high-plasticity excavation material, or connect with geotechnical professionals who understand these properties, platforms like DirtMatch exist specifically to make those connections efficient, cost-effective, and data-informed.
The ground beneath our infrastructure deserves the same rigorous attention we give to the steel, concrete, and timber above it. Understanding soil plasticity and liquid limit is where that attention must begin.